Market Information
![]()
Charts of the Day – May 2, 2024


Market Commentary – May 2, 2024
by: Chris Betz
| Corn | Soybean | Wheat | |||||||
| Old Crop (futures month, change, settle price) | CN4 | 9’0 | 459’6 | SN4 | 28’6 | 1199’0 | WN4 | 5’0 | 604’2 |
| New Crop (futures month, change, settle price) | CZ4 | 6’6 | 479’4 | SX4 | 22’6 | 1187’6 | WN5 | 3’0 | 685’0 |
Technical Thoughts – May 2, 2024
By: Ken Lake
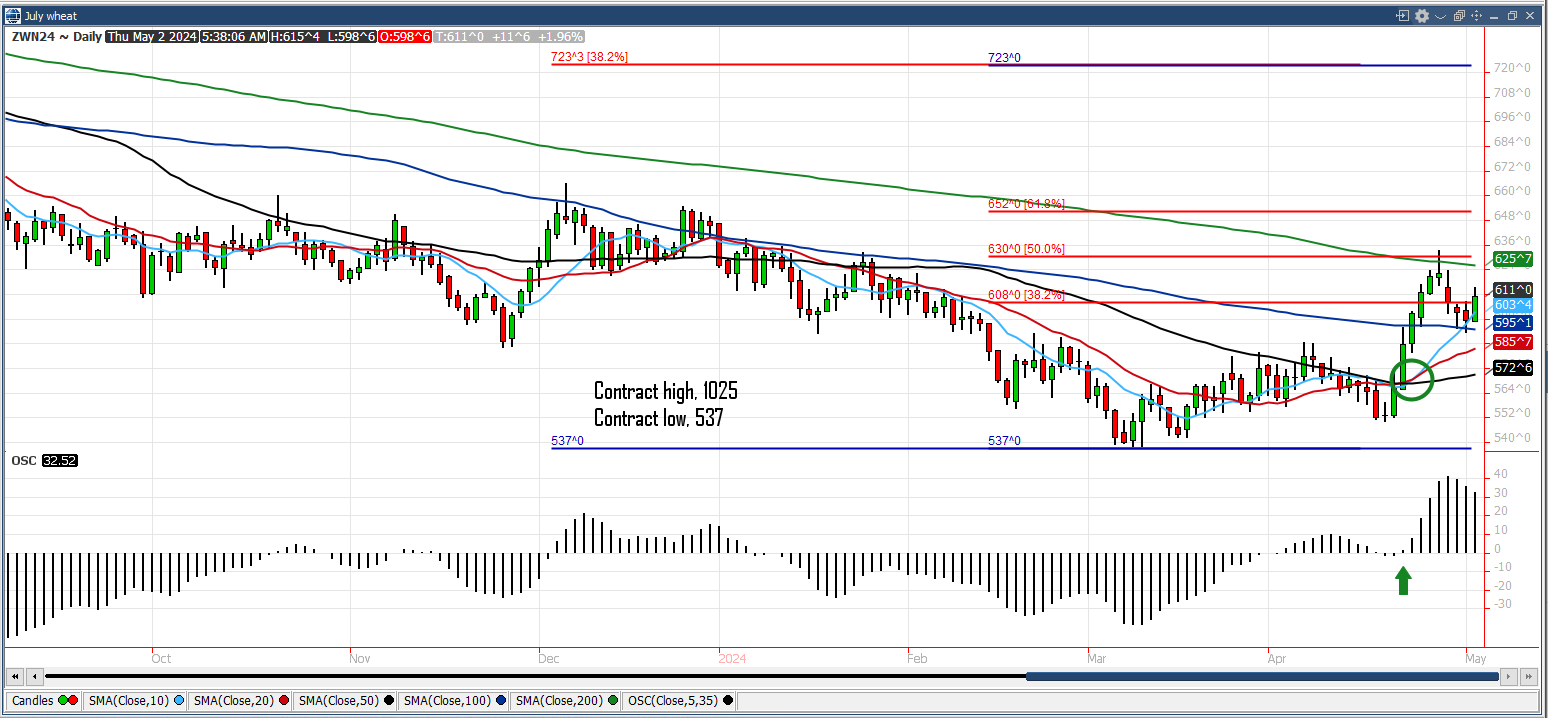
July wheat completed a pattern of 3 consecutive lower closes yesterday after a countertrend move of 6 consecutive higher closes. That 3-day correction lower typically signals a resumption of the longer-term trend, which is lower. The overnight strength may give us another chance to retest the previous high, 633, but failure to extend beyond 633 would confirm the long term down trend remains intact. Work targets at 630 with sell stops at 608, 603.
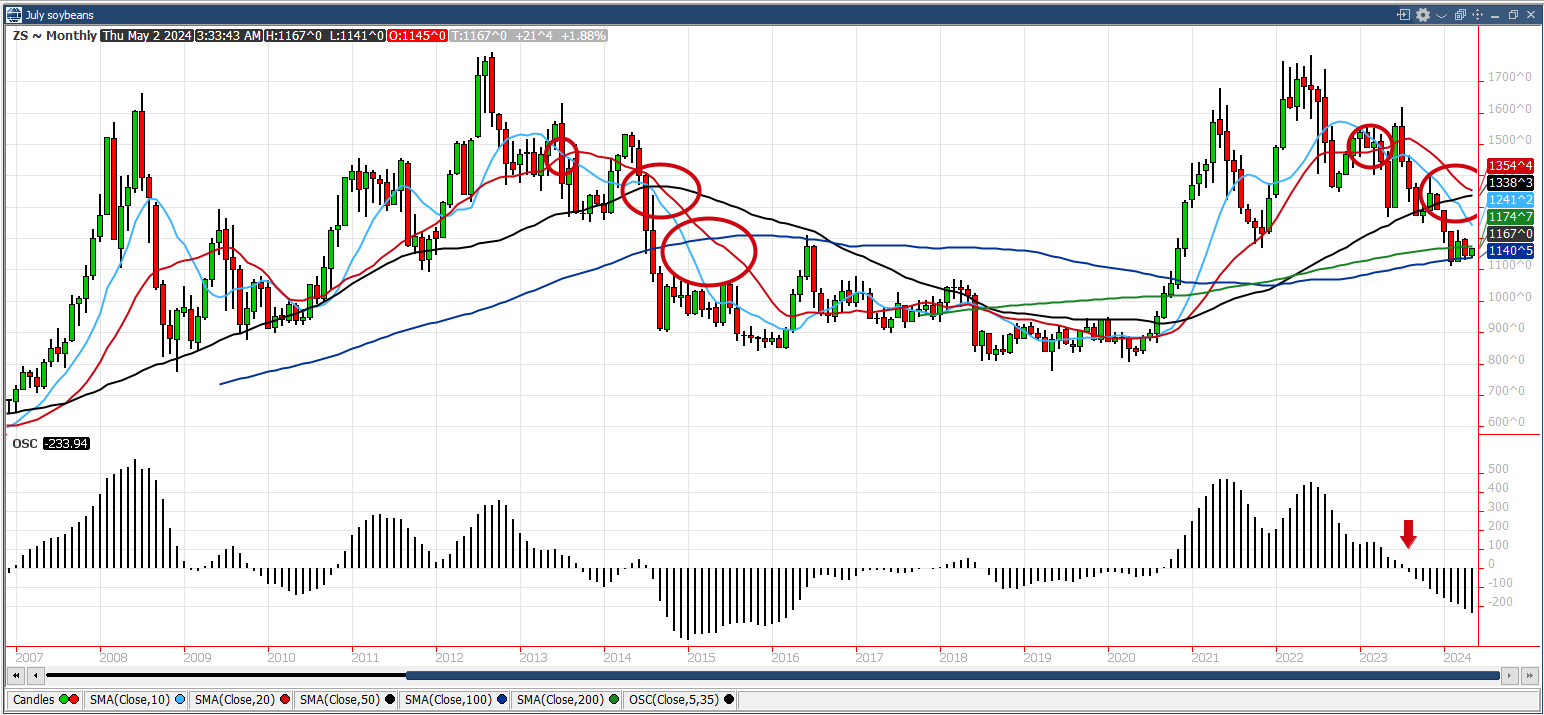
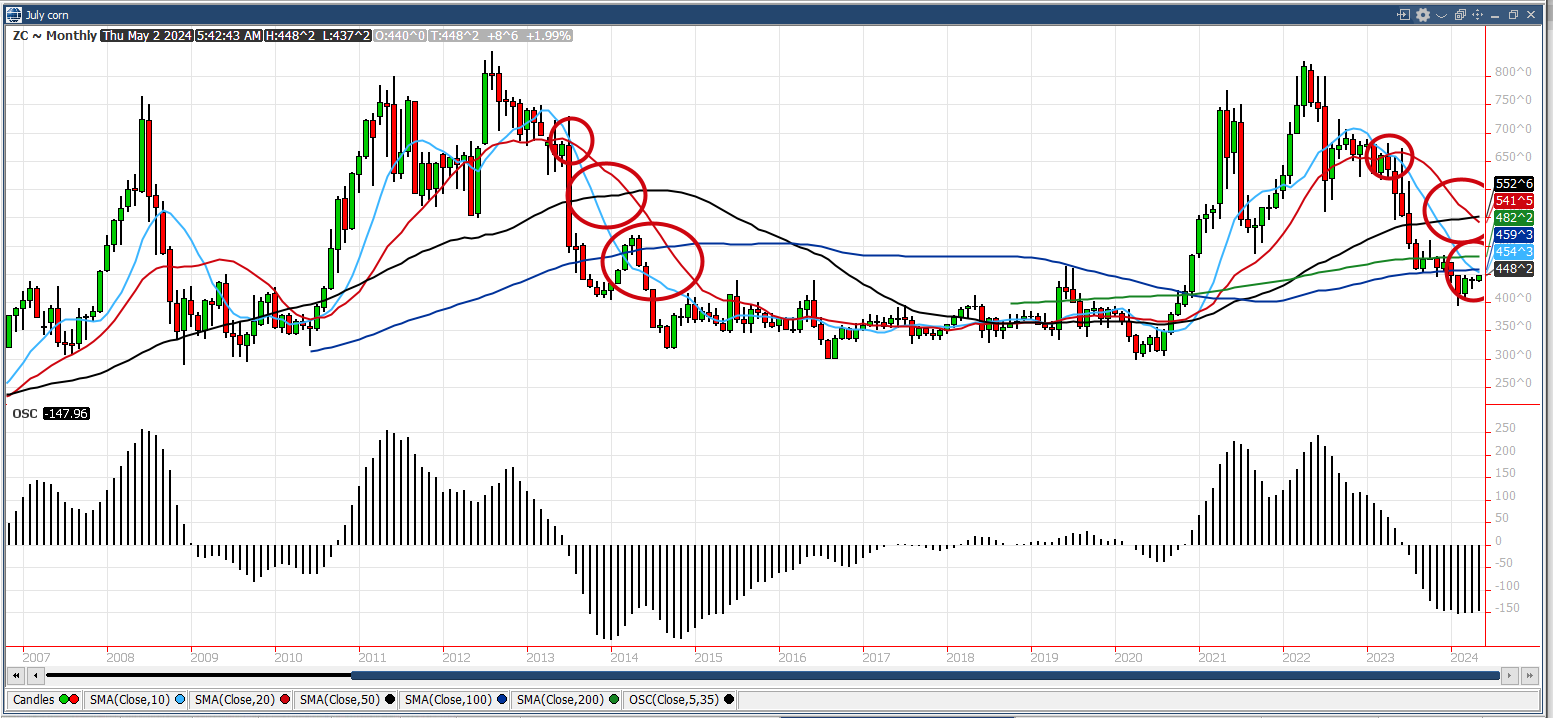
The monthly soybean and corn charts speaks volumes when it comes to looking at values going forward. Soybean and corn values today mirror closely the patterns displayed in the aftermath of the 2012 drought runup. Note on the charts below the bearish crosses made in the 2012/2014 period. Both sectors have copied 2 of the 3 crosses in soybeans and 3 of the 3 crosses in corn.
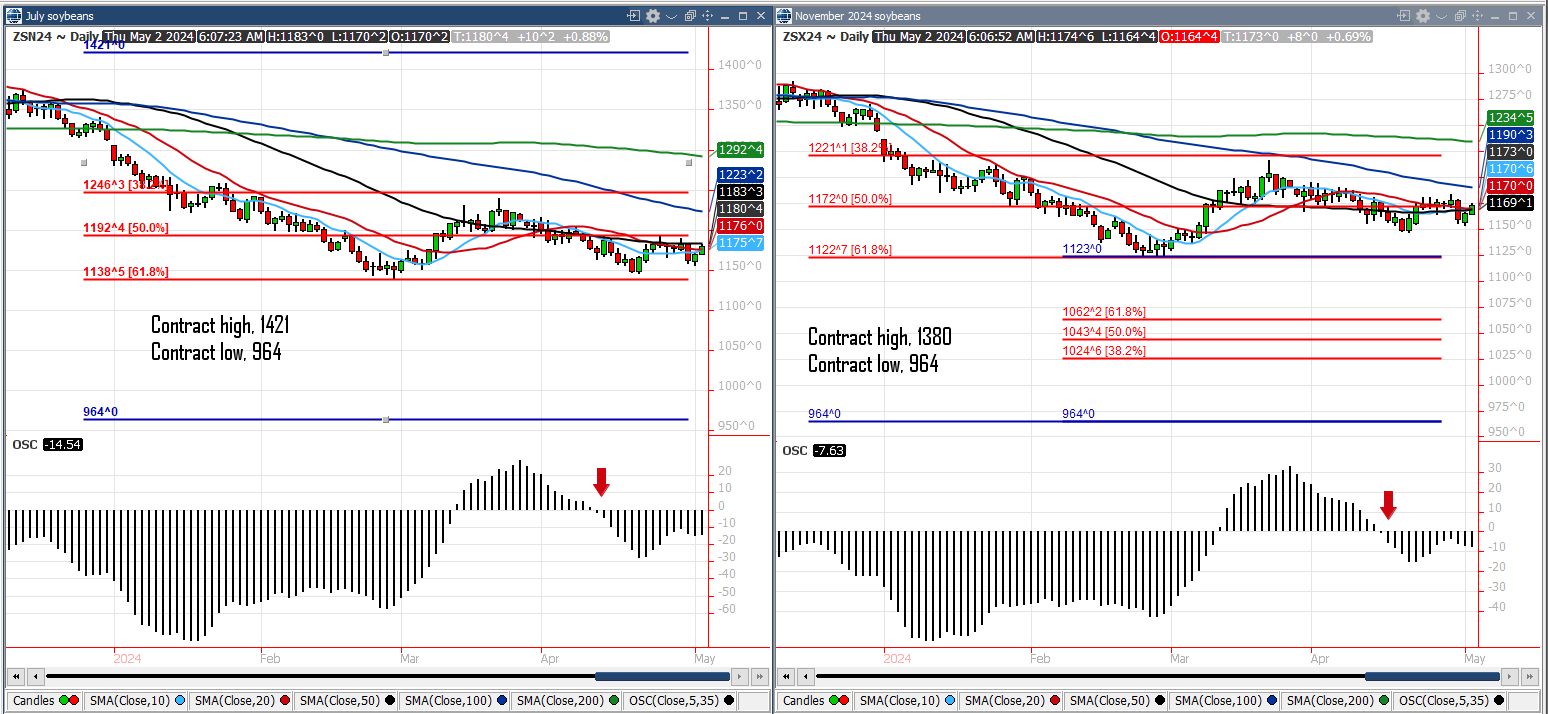
July soybeans are testing upside resistance this morning at 1183 with major resistance being 1192. Downside support is the 61% Fibonacci value at 1138. There is weak double bottom support at that number and a close below 1138 would be damaging. The upside target is 1192 with sell stops at 1138.
November soybeans continue to stubbornly trade around the Fib value at 1172. Short-term moving averages (10,20,50) have consolidated around that number. Longer-term moving averages (100,200) continue to work lower. upside targets on a breakout higher would be 1190, 1221, 1234. Sell stops should be 1122.
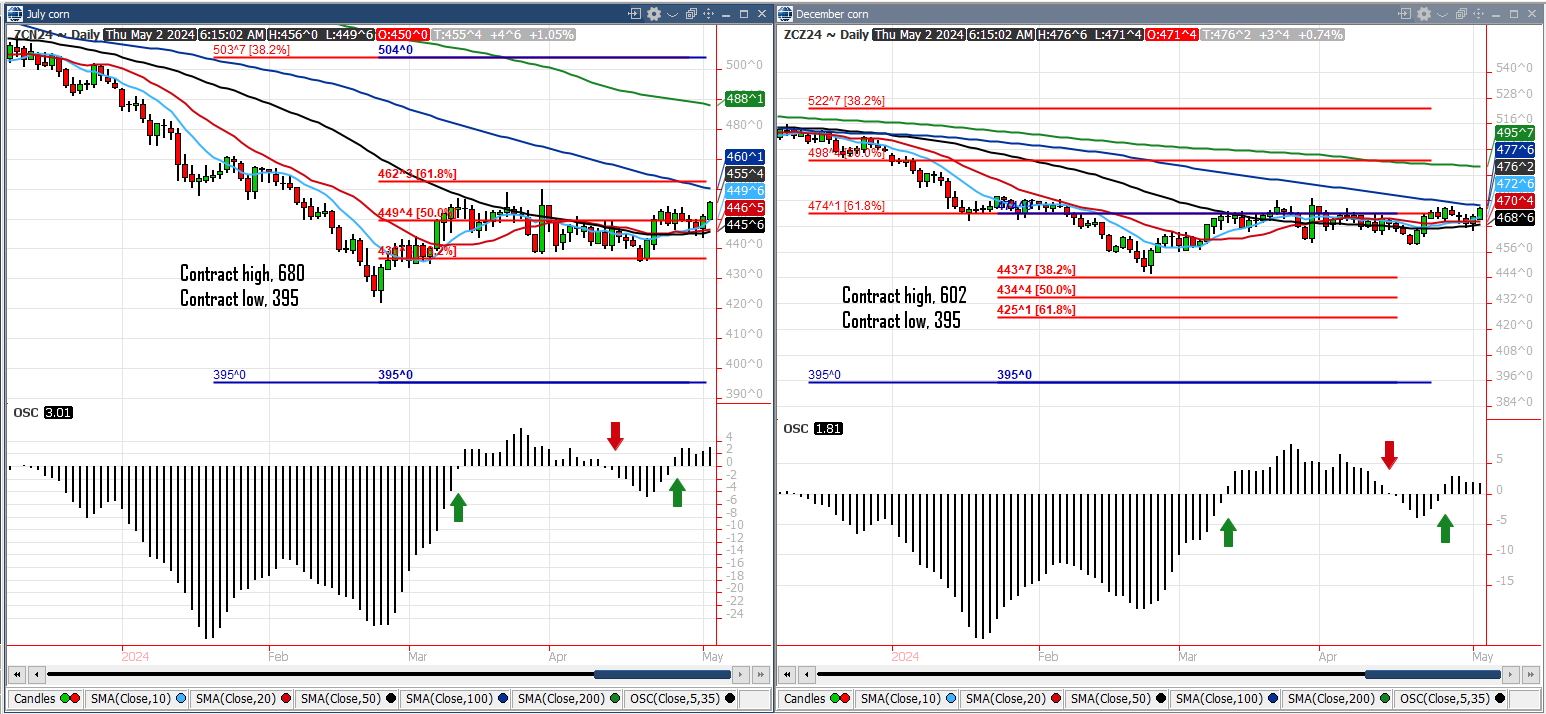
July corn has been trading in a narrow range surrounding the Fibonacci number at 449 for some time now. Daily chart support is 445, resistance is 462. Sell stops should be 436.
December corn has shown amazing resiliency around the Fib number at 474. A breakout is warranted for this contract. Upside target on a break higher is 498. Downside target on break lower is 443.
Fertilizer Update – April 15, 2024
By: John Ezinga
The situation in the Middle East have the markets a little choppy.
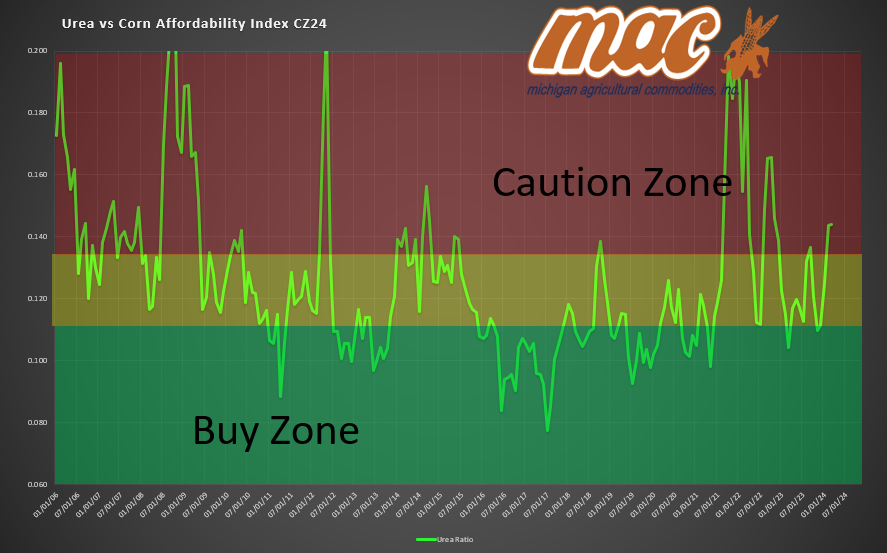
Urea is looking for a floor and if you have followed the charts lately you can see it was due a correction.
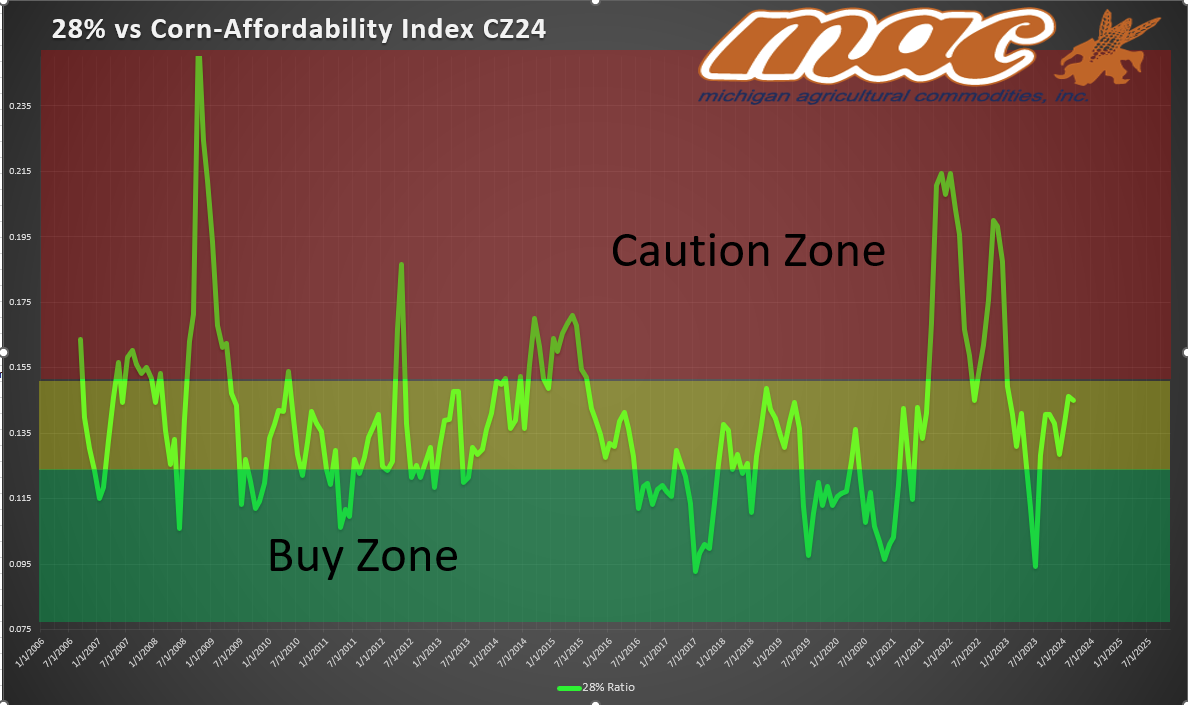
See below….urea was in the red last week and 28% was in the neutral zone. They usually run together so having urea come down makes sense.
AMS is finding more demand every year. Sulfur is a key component that does not come free in the rain anymore.
I think we could see a large shift in acres if the weather is not good for corn planting. Economics favor soy plantings so if planting conditions waver at all the shift will be ON!